 Donate
Financials
FY25 Impact by the Numbers
- 51 Students enrolled
- 90% Completed training
- 39 FY25 Graduates
- 64% Placement rate
- 70+ Employer partners
- 27 Graduates placed
- 35 Teens in Pre-Employment Program
| Metric | FY2023 | FY2025 |
|---|---|---|
| Annual Enrollment | 33 Students | 51 Students |
| Annual Graduates | 24 | 39 |
| Employer Partners (new/yr) | 7 new | 11 new |
| Fundraising Revenue | $788K | $1.03M |
| Government Funding | $143K | $287K |
| Total Sales | $745K | $868K |
Revenue
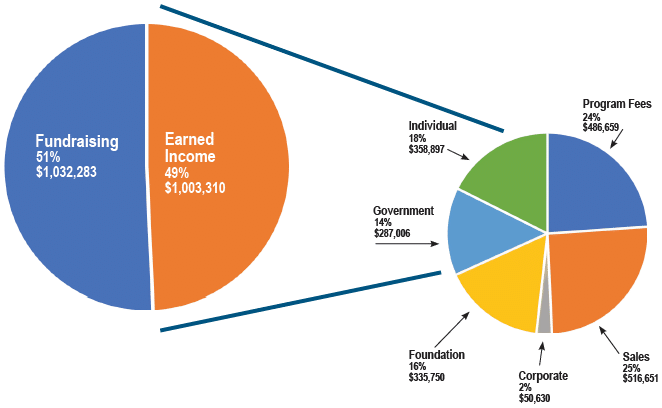
49% earned income (sales, program fees)
51% contributed income (individual gifts, institutional and governmental grants, events)